To define a contour line, select the Add/Remove Contour from
the Plot
Menu.
This will display a dialog similar to this.

The user then selects which solution value they would like to define
contours for. For example, the user might select
BoronActiveConcentration from the list in the left column. The
the user would press the [Plot >>] button to add
BoronActiveConcentration to the list of solution values which
will have contour plots.

Once the user has selected all of the solutions for which contour plots are desired, he presses [Ok]
In th right hand side border of the plotting window, below the region
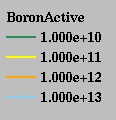
legend, a contour legend should appear that looks like this.

To create more contours for the same solution, double-click on the text
BoronActive in the contour legend. This will pop up a dialog
which looks like this.

The user can change the label for each solution printed in the contour legend by typing in the first field.
The next two entry fields and the slider at the bottom are designed so that the user can quickly create a series of contour values. The first entry contains the value of the first contour. The second entry contains the value of the increment between contours, and the slider designates the number of contours that will be made.
Finally, the [Log Scale] button shown in the upper right is to toggle between a logarithmic scale and a linear scale.
For example, if you wish to make 4 contour lines, every 1e10 with the first contour line at 10e10, simply slide the Number of Contours slider to 4.
When finished press [Ok] to accept the changes or
[Cancel] to abort the operation. The contour legend should then
look like this.

To change the color of an individual contour, or to change the value
of an individual contour, double-click on the text to the right of the
colored line which represents each contour. For example, to change the
first contour (1.000e+10) to red and to the value
1.000e+14, simply double click the text that says
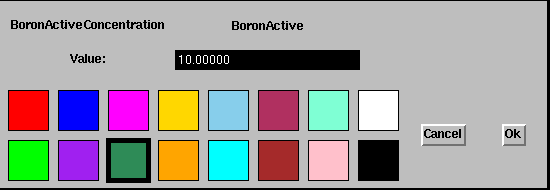
(1.000e+10) and this dialog should appear.

Now the user can enter a new value for this individual contour (without affecting the other contour lines of this solution) and can change the color.
Removing contours requires returning to the Add/Remove Contour option under the Plot Menu. and selecting from the list as before.
 IPlot Home Page
 Technical Doc's
 User's Guide